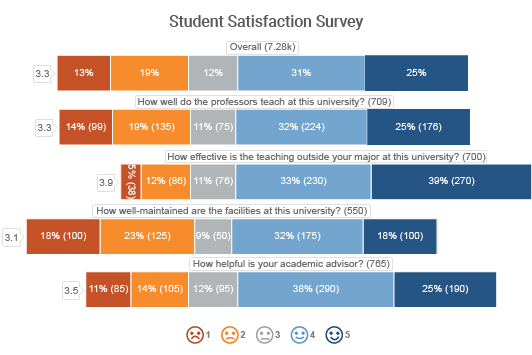
Likert Scale Chart
Know More, Guess Less.
Take the Guesswork Out
of Knowing Your Audience.
Surveys are great, but the responses can be hard to analyze. They don't have to be.
The Likert Scale Chart helps you become mindful of your audience’s attitudes, opinions and perceptions and even know the instant these feelings start to change.
Do you know what’s important to your audience?
Google Sheets
Microsoft Excel
Microsoft Power BI
Free 7-day trial (no purchase necessary). Pricing starts at $10 per month.
 ChartExpo for Google Sheets is
 used by 330,000+ users worldwide!
Click this link to watch a ChartExpo for
Google Sheets single-user installation video.
Click this link to watch a ChartExpo for
Google Sheets admin installation video.
Click this link to watch a ChartExpo
for Excel single-user installation video.
Click this link to watch a ChartExpo
for Excel admin installation video.
ChartExpo for Power BI video.
What is a Likert Scale Chart?
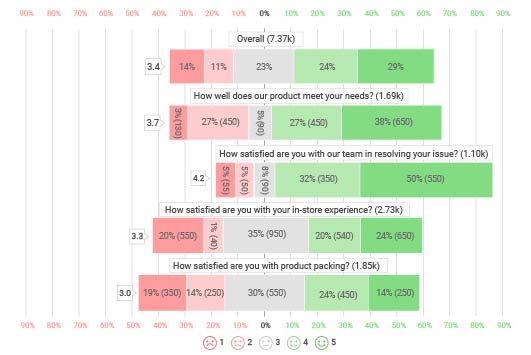
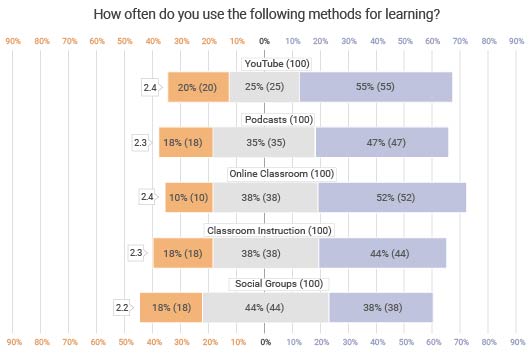
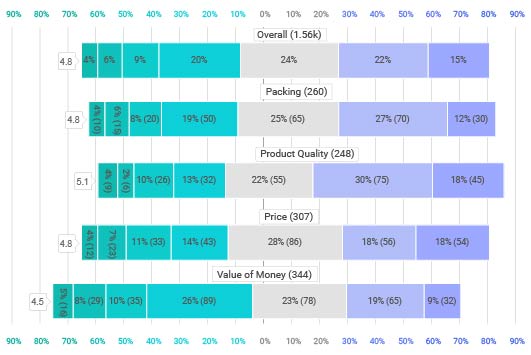
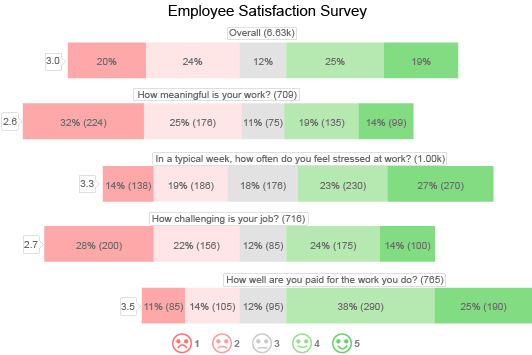
The Likert Scale Chart is the easiest way to visualize your survey results. It uses a simple scale and puts concrete numbers behind intangible feelings and attitudes.
Drill down to the bottom of how your audience feels and respond appropriately. You can make direct improvements to your strategies that align with what the audience wants most.
You’ll always know how to please your audience with the Likert Scale Chart.
When it comes to survey responses and customer feedback, the Likert Scale is the best and easiest way to analyze and understand this information.
Before you can understand the Likert Scale advantages, you must first learn the Likert definition and purpose.
Likert Scale Definition
The Likert Scale is a multi-point rating scale. You can use this tool to gauge opinions, thoughts, attitudes, perceptions and other hard-to-measure feelings.
The most common and effective use of the Likert Scale is analyzing survey responses.
Rensis Likert, a psychologist, invented the scale in 1932. Initially, he used it to measure feelings regarding international affairs. Once he realized the effectiveness of his system, Likert applied the scale to other pursuits.
In practice, the Likert Scale and its questions aim to measure sentiments regarding a single topic. This allows you to pose multiple questions or statements regarding the subject and then compile the total scores to get an overall sense of how people feel or think.
That said, this rule is not set in stone. You can use your Likert Scale questions and responses in any way you choose to fit. This gives you more control over your surveys and audience feedback.
The real “rules” to worry about regarding Likert Scale interpretation are how you pose your survey questions, as this will directly impact the value of your audience’s responses.
How to pronounce Likert: There is a lot of debate over the pronunciation of “Likert.” Most people mispronounce this term and call it the “LY-kert” scale. The correct Likert pronunciation is “LIK-ert.”
Likert Scale Examples
The process of conducting Likert Scale research is both easy and accessible. This makes it a very popular survey method because anyone can use it and receive beneficial results.
There are many Likert Scale examples and other Likert-type scales available to use as inspiration for your own efforts.
If it is your first time using this scale, you should explore some Likert Scale examples. These will help you make the most of your own surveys.
Here are some Likert-type questions to get you started:
How often do you floss your teeth?
- Never
- Rarely
- Often
- Every day
How would you rate your customer service today?
- Very poor
- Poor
- Fair
- Good
- Excellent
How often do you shop online?
- Never
- Very rarely
- Rarely
- Occasionally
- Often
- Very often
- Always
It’s important to note that your Likert Scale survey doesn’t have to be question-based. You can also give your audiences statements to respond to.
Here are some more Likert Scale examples to demonstrate how to use statements instead of questions:
Rate your experience today.
- Very poor
- Poor
- Fair
- Good
- Excellent
Baseball is the most exciting sport to watch.
- Strongly disagree
- Somewhat disagree
- I don’t watch sports
- Somewhat agree
- Strongly agree
The President of the United States is doing a good job.
- False
- Prefer not to say
- True
Hopefully, these Likert Scale examples will help you create your own surveys.
Likert Scale Types
You’ll notice that the number of possible responses is different in each of the above Likert questions and statements. This demonstrates the various point scales you can use with Likert data.
For instance, the first example uses a 4 point Likert Scale. These points refer to the number of possible responses.
How often do you floss your teeth?
- Never (1)
- Rarely (2)
- Often (3)
- Always (4)
Each type has pros and cons, whether you use a 4 point Likert Scale or a 10 point Likert Scale.
A 4 point Likert scale is good because it doesn’t ask too much of respondents. It also makes your Likert Scale analysis much easier because there are fewer scores.
One of the most significant drawbacks to 4 point Likert Scale examples is the lack of a neutral option. Thus, this scale forces your audience to make a choice when they may be indifferent.
This is why the 5 point Likert Scale is the most popular. You can offer two degrees of positive and negative sentiments and include a neutral middle-ground.
Other Likert Scale examples use more points to include a broader range of attitudes. This allows you to measure audience sentiments more accurately.
For instance, a 7 point Likert Scale or a 0-10 scale gives respondents greater choice in their answers. You’ll receive more accurate responses that align with the audience’s true feelings.
The 3 Purposes of a Likert Scale
Before digging into the purpose of the Likert Chart, it’s first necessary to look at the three uses of the Likert Scale itself.
Likert Scale Frequency: The purpose of this type of Likert questionnaire is to measure how often an event or action takes place. You can use this type of Likert Scale to gauge interest and popularity of certain items or subjects.
A frequency-based Likert question might be, “How often do you shop online?” If a respondent cites that they shop online very often, you know they aren’t interested in offers for in-person transactions.
Likert Scale Agreement: This type of Likert Scale question or statement tries to judge the audience’s feelings or perceptions regarding a particular topic.
“Baseball is the most exciting sport to watch” is a statement that respondents can agree or disagree with. You can ask a more direct question like, “Do you agree or disagree with the company’s new policy?”
Likert Scale Satisfaction: The final purpose of the Likert Scale is to test satisfaction. Similar to agreement and frequency, you can use this approach to measure feelings, interests, attitudes and more.
An example of a Likert Scale question measuring satisfaction would be “How would you rate your customer experience today?”
Satisfaction survey questions are some of the most valuable because they get you right to the bottom of customer happiness and what parts of your strategies are most and least successful.

How to Analyze Likert Scale Data
Analyzing your survey responses shouldn’t be a hassle. With the Likert Scale Chart, it doesn’t have to be.
Exploring audience responses with the Likert Scale reveals their likes, dislikes, attitudes and so much more.
Get more meaning and understanding from your surveys when you use a Likert Scale and find out what your audience really thinks.
As your Likert Scale survey begins to receive responses, you need a tool to help you manage and analyze the data.
Otherwise, you may miss certain details that help you understand your audience’s attitudes and sentiments.
This is where the Likert Chart enters the picture. It is the best method for visualizing Likert Scale data.
Start With a Purpose
Before you get to the Likert data, you need to think about the intent or purpose of your survey. This will help you craft better Likert Scale questions that receive stronger, more actionable results.
Remember, the Likert Scale is excellent for measuring satisfaction, frequency and/or agreement. Start with one of these and then think about a specific topic for your survey.
For example, a car dealership may want to measure interest for a new Honda SUV that’s about to come out. The data will help them understand market perceptions and interest in this new vehicle.
Thus, each question included in the dealership’s Likert survey must be relevant to this topic. Otherwise, you’ll end up with Likert data that isn’t relevant to your goal or purpose.
It’s helpful to start with a question of your own and then craft your questionnaire to help you answer it. The car dealership’s question might be, “Are people interested in buying this new Honda SUV?”
If you keep your initial question or purpose on your mind at all times, you’ll have no problem developing Likert Scale questions that provide the results and findings you need.
This will also keep your questionnaires short and sweet, which audiences will love because it isn’t asking much of their time.
Devise Your Likert Scale Questions
Making Likert Scale questions may seem easy, especially given the simple nature of this type of survey.
However, there are some pitfalls you can fall into when crafting your Likert questionnaires, even beyond including irrelevant questions that don’t suit the primary purpose of your survey. There are also some tips to help you make better overall Likert Scale surveys.
Here are the Do’s And Don’ts of Likert Scale questions.
- DO mix statements and questions. This helps keep your audience engaged by varying your questionnaires. It also allows you to be more flexible in the items you want to address.
- DON’T use double negatives. This helps keep your audience engaged by varying your questionnaires. It also allows you to be more flexible in the items you want to address.
- DO use positive and negative framing. This helps keep your audience engaged by varying your questionnaires. It also allows you to be more flexible in the items you want to address.
- DON’T ask about multiple things in the same question. This helps keep your audience engaged by varying your questionnaires. It also allows you to be more flexible in the items you want to address.
For example, if you ask, “Do you agree that red and blue are the best colors?” People who like blue may agree, even though they dislike red.
Visualize The Results with ChartExpo’s Likert Chart
To effectively analyze Likert Scale data, it helps to see the results visually. Raw data alone is too hard to read and process.
There’s actually some science behind this. The human brain processes visuals 60,000 times faster than text and raw numbers.
Visual information is also easier for the brain to retain and comprehend. So, you’ll understand more about your audiences and keep these insights stored in your memory for longer.
The best tool for visualizing Likert Scale data is ChartExpo. This add-on works with Excel or Google Sheets and converts your spreadsheets into beautiful and helpful visualizations.
Once you have a spreadsheet including all of your Likert data, you’re almost ready to make a Likert Scale Chart. Seriously, that’s how easy the ChartExpo system makes it to create Likert Scale visualizations.
All you have to do is choose the Likert Chart from the list of available options (ChartExpo is a library of charts and visualizations for all types of data). Then, select the data from your spreadsheet and press “Create Chart.”
That’s it!
This super simple Likert Chart tool saves you lots of time and allows you to almost instantly begin pulling audience insights from your survey responses.
Analyze Your Likert Scale Chart
Again, the simple structure of the Likert Scale means your analysis is pretty straightforward. Plus, visualizing Likert Scale data with ChartExpo makes it even easier.
That said, there are certain things to look for in your Likert Chart that will help you focus on the correct areas of your data and ensure that you don’t miss any valuable audience insights.
Overall sentiment: Your first analysis objective is to figure out the overall sentiment for your survey topic. This may require you to tabulate all of the data from your survey questions.
Alternatively, you may include a survey question explicitly asking for the audience’s overall feelings about the topic.
In most Likert Scale examples, you can easily calculate overall sentiment by assigning a point value to each score. This will give you a total numerical value, whether positive or negative.
Biggest problems first: Positive sentiment is nice and helps you feel good when the audience agrees or is on your side. However, negative perspectives can be far more useful because they show what needs improving.
When you review your Likert Chart results, look for the most significant sources of negative feedback. These are the most substantial holes in your products or services that need immediate repair.
Don’t ignore neutral responses: It’s easy to disregard a neutral Likert Scale response because it doesn’t share any positive or negative sentiments.
However, these middle-ground responses represent crucial participants. It’s the people on the fence about feeling one way or another. Thus, they are the people easiest to sway in your direction.

The Easiest Way to Visualize Survey Responses
Successful surveys require lots of time and attention. The Likert Scale Chart presents the easiest way to visually analyze the information and truly understand your audience.
The Likert Scale simplifies your survey responses, making them easier to understand even in large volumes.
You don’t have to be a data wiz to create a Likert Scale that perfectly captures your audience’s sentiments.
Surveys are valuable tools to receive feedback from audiences. There are many methods to conducting surveys, but none as simple and effortlessly effective as the Likert Scale.
When you combine the Likert Scale with ChartExpo’s easy-to-use Likert Chart, you have a winning strategy for visualizing survey response data.
Easy to Read and Measure (and for Audiences to Use)
Whether you’re using a 4 point Likert Scale or a 0-10 scale, the structure of this survey response method is exceptionally easy to use.
Each possible response is clearly and logically arranged on a linear scale. And, you can easily distinguish the sentiments behind each response, as long as you use appropriate Likert Scale labels for each entry.
By assigning a score to each possible response, the Likert Scale also becomes easy to measure. Consider the following Likert Scale question example with scores for each reaction:
How would you rate your customer service today?
- Very poor (-2)
- Poor (-1)
- Fair (0)
- Good (+1)
- Excellent (+2)
These are easy numbers to work with, making it easy to calculate overall sentiments.
As a tip, try weighing negative responses more than positive ones since these are more detrimental to audience perceptions.
The structure of the Likert Scale isn’t just easy from a survey maker’s perspective. Respondents of your questionnaire also find the questions, statements and scoring system exceptionally straightforward.
Audiences face almost no confusion or questions when taking a Likert Scale survey, as long as you write straightforward questions for participants and provide responses with limited subjectivity.
Less Work than Open-Ended Responses
The goal of the Likert Scale is to put numbers behind audience attitudes, perceptions, likes and dislikes. This helps you quantify these intangible feelings in a way that is usable by your team — in a way that creates data.
This makes audience feedback much easier to work with and extract insight from, especially compared to open-ended responses.
While open-ended responses give you more details and feedback, the unstructured text data is much harder to mine for insights. If you have thousands of survey participants, you have to read thousands of responses. It takes too long.
The advantage of the Likert Scale approach is that you can easily tabulate the results and gain valuable understanding, without manually reviewing every response.
Again, this also makes a Likert Scale survey more accessible to participants. It’s much easier to punch in a score on a 0-10 scale than to write a small essay detailing your experiences, thoughts and feelings.
This makes the Likert Scale the best and most efficient way to utilize audience feedback and surveys.
No Coding Required to Make a Likert Scale Chart
Many data visualization tools may promise a Likert Scale Chart. However, the majority of these tools rely on scripts and codes to implement this survey chart into Excel or Google Sheets.
If you aren’t familiar with these scripts, or coding in general, you may face a steep learning curve before you can begin visualizing Likert Scale data. This delays your ability to respond to audience responses and improve your strategies.
Even once you acquire the coding aptitude, this process will still take up lots of time because you have to manually enter the data into the script to create your Likert Chart.
This also raises your risk of accidentally inputting incorrect figures, thereby producing an inaccurate chart.
ChartExpo eliminates these problems by doing all of the coding for you. All you have to do is select the data you want to use for your Likert Chart and press “Create Chart.”
The visualization tool works with Google Sheets and Excel, so you don’t have to import the chart into your spreadsheet.
With quicker and easier charting, you can turn your Likert Scale into actionable audience insights faster than ever.
Create a Likert Scale Chart in 3 Easy Steps
The speed and ease of ChartExpo’s Likert Scale Chart maker can’t be overstated. These are significant advantages that will save you time and money.
This is one of the primary objectives of ChartExpo — to provide advanced charting options to all users through an exceptionally simplistic but effective interface.
Once you’ve successfully installed the tool, you can start going from spreadsheet to Likert Scale Chart in just three steps.
First, you select the Likert Scale Chart from the available options. ChartExpo includes visualizations to choose from. There’s a charting option for all types of data, no matter how simple or varied.
You can use the search bar to quickly locate the Likert Chart. After selecting it, tell ChartExpo which parts of your spreadsheet to visualize.
This is the most time-intensive step. However, because Likert Scale data is structured and straightforward, it will only take you a few short clicks to select the right parts.
After this step, click the button to create your chart and you’re done. You can begin exploring your Likert Scale Chart and discovering valuable audience insights.
Master Attitudes, Opinions and Perceptions with Likert Scale Chart
The Likert Scale Chart allows you to become hyper-aware of what’s most important to your audience. The moment your audience’s attitudes start to change, you’ll know.
The Likert Scale Chart enables you to make swift improvements to keep your audience happy and engaged.
If you can continuously meet your audience’s needs and capitalize on what they want most, success and growth are guaranteed!
Knowing what’s important to your audience is crucial to success. It helps you deliver products, services and offers that customers or clients actually want and care about.
The challenge is tracking when perceptions and attitudes change, especially for the worse, and having the ability to step in and make appropriate corrections.
You always want to keep the audience happy!
How Well Do You Know Your Audiences? Likert Can Help
Any business or organization benefits from knowing its audience. It’s an essential piece of the puzzle to help you succeed.
If you don’t know who your customers, clients, benefactors, members, etc., are, you can’t possibly know how to engage them and encourage them to convert or act.
The problem is that getting to know your audience on a personal level is extremely difficult. Surveys are one of the few tools you have to get genuine feedback.
Thanks to the Likert Scale, survey data is accessible and easy to work with, meaning you can begin learning tangible details about what the audience likes, dislikes, feels and so on.
You may not be able to change these feelings or beliefs directly. However, you can adjust the products, services and offers you send to better accommodate the audience’s desires.
The Likert Scale can help you measure satisfaction, beliefs and opinions, likes and dislikes and so much more.
If you feel you aren’t getting enough insight from your surveys, it’s time for a new approach. It’s time for the Likert Scale!
A Deeper Understanding of Your Surveys
The problem with most survey methods, especially ones with open-ended questions, is you receive a lot of feedback that is personal to just one individual. It may be an experience, a feeling or otherwise.
The problem with this is you can’t make judgments about your entire audience based on the experiences of one individual.
It’s easy to be misguided by what one person believes, only to find out that this opinion is not held by everyone.
Surveys made with the Likert Scale don’t fall into this trap. Instead, Likert surveys measure across the board, allowing participants to match their feelings to a predetermined range of responses.
Your Likert Scale allows you to more deeply understand your surveys and your audience’s feelings. It paints a fuller picture of audience attitudes and perceptions, giving you the chance to make relevant improvements to your strategies that appeal to the majority of your audience, not the minority.
It’s about receiving actionable feedback from your audience that you can immediately put to work. Otherwise, you’ll get bogged down in too many irrelevant details that don’t accurately represent the majority of your audience.
Continuously Improve Your Audience-Facing Strategies
You can’t directly control the feelings or attitudes of your audience. It’s up to them to change their mind and alter how they feel.
What you can do is change your audience-facing strategies. These are the things you do that audiences see or interact with directly, including your marketing campaigns, products, services, ads, loyalty programs, etc.
Anything that your audience sees or engages with directly can be improved using the Likert Scale.
You can construct Likert Scale surveys specific to the types of strategies you want to improve most. This is particularly valuable to businesses that want to boost sales and offer better products than competitors.
The ease of this survey system makes audience insights more accessible than ever, meaning you can continuously improve your strategies to match the latest attitudes.
A continuous approach to surveying your audience and adapting to their attitudes ensures that you always keep their attention.
When you create new strategies, you can lean on these insights to put your best foot forward and offer experiences that align with what the audience wants.
You remove the possible risk of spending time or money on things that don’t appeal to their interests directly.
That’s a Likert Scale advantage that any organization or business can benefit from!
Respond Faster to Changes in Perception
Studying your audience’s attitudes, opinions and perceptions isn’t something you want to do once. It should be a regularly scheduled activity.
After all, people’s opinions and feelings can change over time, even day to day. This means your Likert Scale results may be radically different each time you survey the audience.
That’s why you want to proactively use the Likert Scale Chart with your survey data. You can update the chart routinely when you have new response data. This gives you an almost living view of what your audiences like or dislike in the current moment.
When attitudes shift dramatically, your Likert Scale Chart will visually reflect the difference. One look at the visualized information and you’ll instantly recognize what’s changed.
This allows you to act swiftly and make the necessary changes to curb negative sentiments or capitalize on positive ones.
In some situations, negative sentiment can save you from having a massive crisis. For example, say your best-selling product suddenly starts receiving lots of negative survey feedback.
You investigate further and find out that there is a major defect causing the product to dangerously malfunction.
Thanks to the Likert Scale Chart, you’ve detected the problem early and can correct it to fix further problems.
The faster you respond to these swings in audience sentiment, the easier it is to maintain an overall positive reputation and avoid potential crises that can cause irreparable damage.

Get To Know Your Audience Like Never Before
Survey responses are incredibly valuable, but can be difficult to understand in large quantities.
Don’t get bogged down in surveys that don’t lead to actionable results. The Likert Scale Chart helps you ask fewer questions, but receive more valuable answers.
The Likert Scale is the most flexible and adjustable survey style. Charting your results will lead to helpful insights that create positive changes to audience perceptions.
The Likert Scale isn’t just another method for conducting your surveys; it’s a proven technique for achieving better survey results.
It has to do with efficiency and accessibility. The Likert Scale is easier to use, more flexible and helps you discover insights to improve your strategies.
Write Better Likert Scale Surveys and Questions
Producing the best Likert Scale data depends on the quality of your survey and the questions you ask the audience.
You may not write the perfect Likert Scale survey the first try. It’s more likely that you will refine your questions over time. You’ll remove questions that are no longer relevant or have already been answered and add new ones to take their place.
The Likert Scale Chart helps you identify the survey questions and statements that provide value and those that don’t.
Since the visualization makes the data so accessible, it’s easier to recognize how audiences interact with your Likert Scale surveys.
Here are a few things to look out for to help you write better Likert Scale surveys and questions.
- Overwhelming positive sentiment: When a question receives overwhelming positive responses, you can safely put it to bed, at least for the time being. You may want to reintroduce this question later to test if attitudes or perceptions have changed.
- Too many neutral responses: If you include Likert Scale questions or statements that include a neutral option and it receives the majority of the scores, you can surmise that this is a topic that your audience doesn’t care about or have opinions regarding.
- Inconclusive data results: A 0-10 scale or higher can produce a wider depth of results. However, it may impede your ability to draw insights from the data. If you can’t reach any conclusions because the data is spread out, it’s a good time to switch to a 5 point Likert Scale or smaller.
More Likert Scale Options Mean More Flexibility
Every organization is different and so is its audience. Your survey objectives are unique to you, which means you need a flexible method to accommodate your personal needs.
The vast options available with the Likert Scale make it one of the most flexible ways to request and review audience feedback.
Not only can you choose different point scales, from a 3 or 4 point Likert Scale to a 10 point Likert Scale or higher, but you also have substantial freedom in the types of questions or statements you pose to your audience.
For instance, you can ask about their satisfaction regarding a particular product or experience. Alternatively, you can pose questions regarding shopping habits or interest in certain items.
It’s entirely up to you what you want to survey and how you want to present your questionnaire to your audience.
This level of flexibility removes the annoyance of having to sift through responses to find the information you want. With the Likert Scale, you’re in the driver’s seat and control the topic and how audiences provide their feedback.
You can even vary your Likert Scale questionnaires to include both negatively and positively framed queries. This will keep your results unbiased and ensure you receive accurate and valuable responses.
Use the Likert Scale that Fits Your Needs
A key part of the flexibility of the Likert Scale is the ability to control the point scale that you use. This function plays a critical role in the depth of audience insights you receive.
You have to think strategically about the Likert Scale you use. A 10 point scale offers more options, providing a wider spectrum of responses and attitudes. However, it requires more time and effort from your audience.
Conversely, a tighter 5 point Likert Scale is less work for the audience and can still provide you with great insight into their behaviors and perceptions.
The type of survey responses you’re requesting also impacts the best scale to use. For instance, if you are trying to gauge audience opinions regarding a particular topic or issue, using a 4 point Likert Scale can be problematic.
Since there is no room for a neutral option, you force survey participants to choose a side, even when they don’t have an opinion on the topic or are unfamiliar with it. Thus, a 5 point Likert Scale is the superior option because the fifth option permits you to have this neutral choice.
Likert Scale Chart Insights Lead to Positive Change
A pivotal part of analyzing Likert Scale data is the visualization stage. This is where you take your raw survey responses and visually plot the Likert Scale responses.
Visualizing Likert Scale data provides you with a physical depiction of the information. You can physically see what’s happening behind all the data points you’ve acquired using the Likert Scale survey.
In other words, it shows you the story behind your data, which furthers your understanding of the information and the insights shared by your audience.
These audience insights provide you with clues on how to directly improve your strategies and create positive change in your organization.
ChartExpo’s Likert Scale Chart is the best tool for visualizing Likert Scale data. Not only does it give you a means to visually depict your Likert Scale examples, but the hassle-free creation process saves you ample time and headaches.
You can create a Likert Scale Chart in just three clicks with ChartExpo. This gets you to those actionable audience insights in even less time than other charting tools. You can immediately begin making those essential positive changes to improve your strategies and offerings.
ChartExpo Pricing
ChartExpo for
Google Sheets
$10*
per month
(no purchase necessary)
*pricing starts at $10
per user per month.
Only in-app purchase available
ChartExpo for Google Sheets
single-user purchase video.
ChartExpo for Google Sheets
domain-users purchase video.
ChartExpo for Google Sheets
single-user installation video.
ChartExpo for Google Sheets
admin installation video.
ChartExpo for
Microsoft Excel
$10*
per month
(no purchase necessary)
*pricing starts at $10
per user per month.
Only in-app purchase available
ChartExpo for Excel single-user
purchase video.
ChartExpo for Excel domain-users purchase video.
ChartExpo for Excel single-user
installation video.
ChartExpo for Excel admin
installation video.
ChartExpo for
Microsoft Power BI
$10*
per month
(no purchase necessary)
per user per month.
Only in-app purchase available
for Microsoft Power BI video
Custom Pricing
Videos

4:03
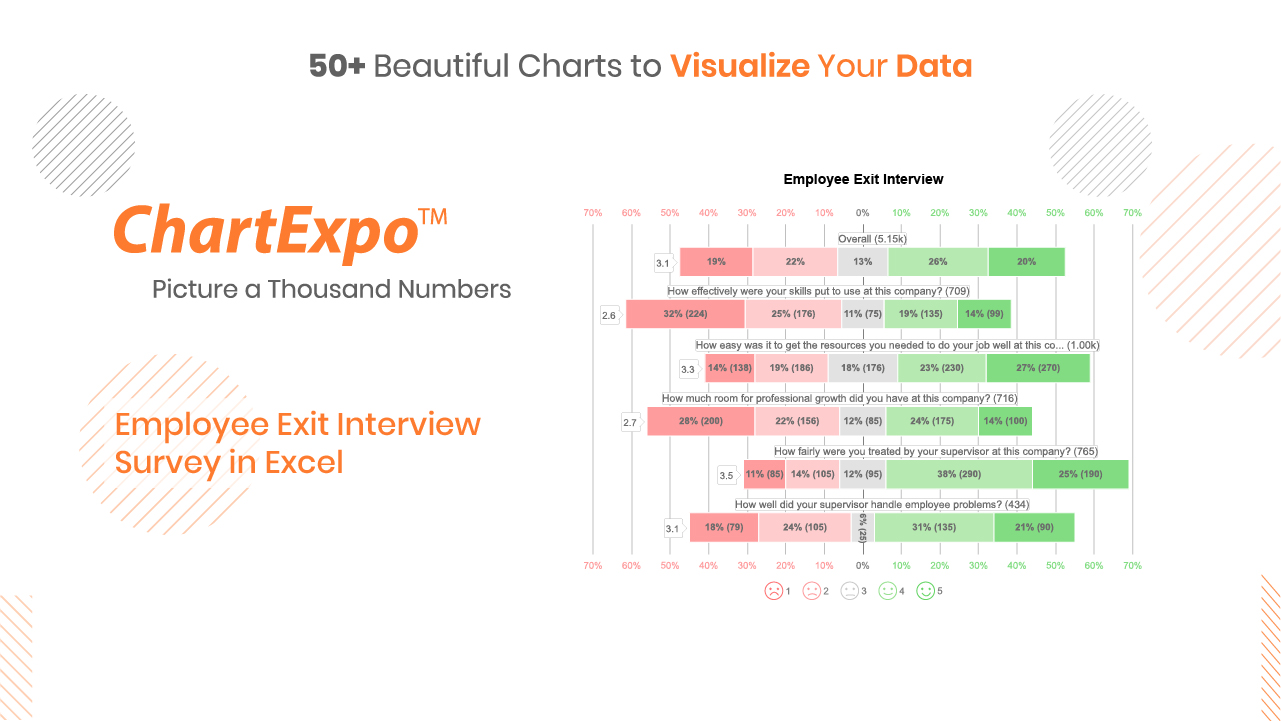
2:43
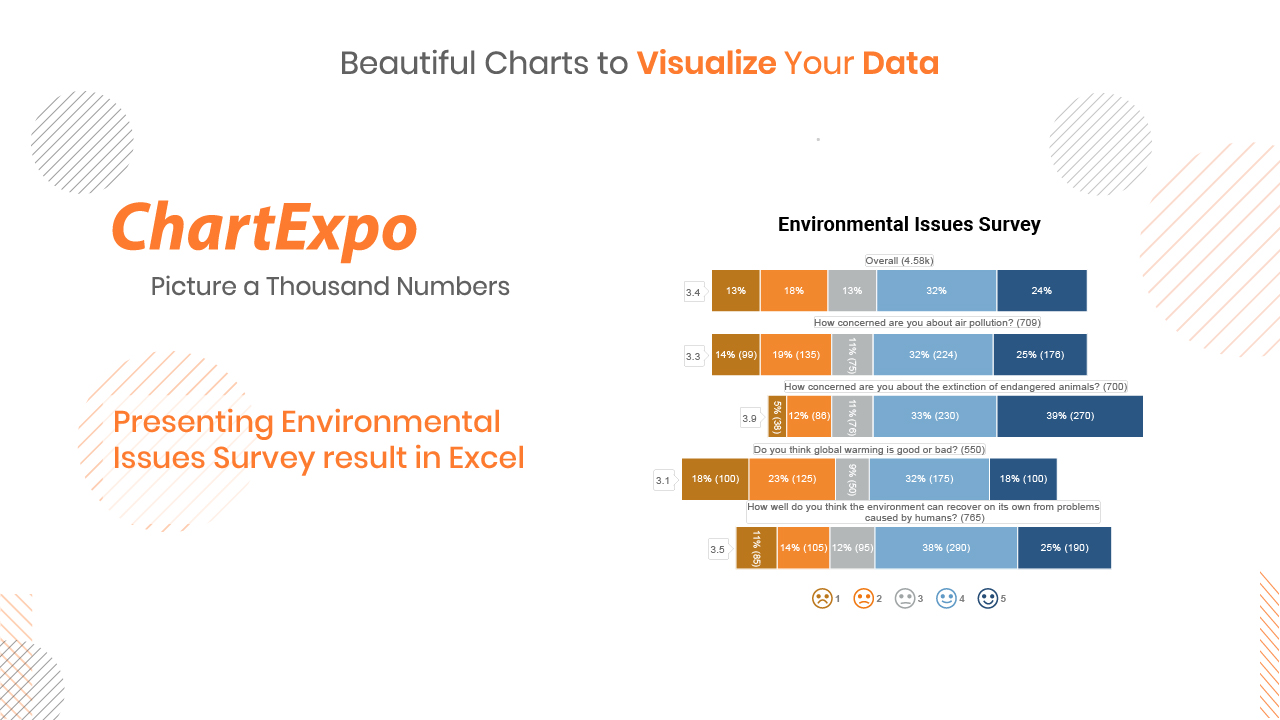
3:59
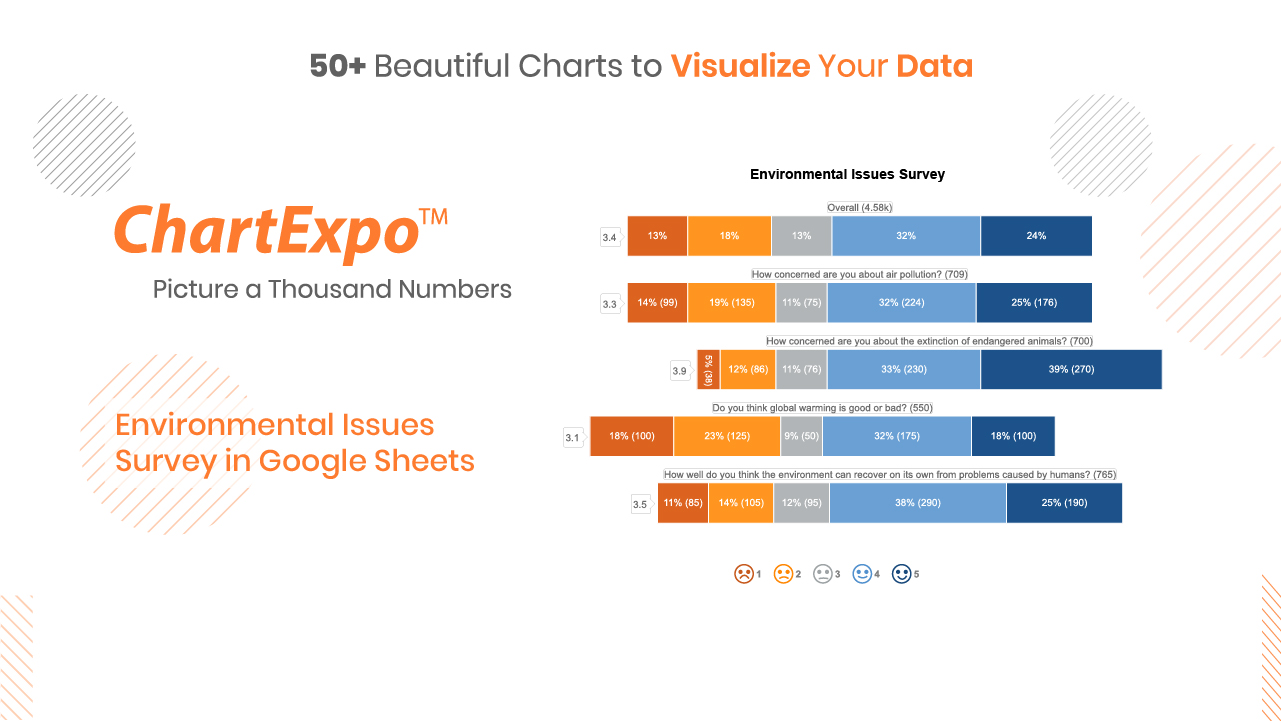
4:46
Blogs

Graphing Survey Results to Highlight Data Stories in Excel
Click to discover how to visualize or graph survey results in Excel. You will also learn...

Likert Scale Types for Survey Analysis – A Complete Guide
A complete guide on the best Likert Scale types you can use in your survey analysis. Learn What is a...
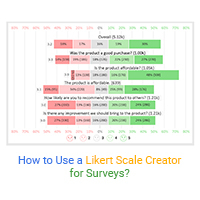
How to Use a Likert Scale Creator for Surveys?
Click to learn how to use a Likert Scale creator for your data stories. We’ll unveil fresh tips...
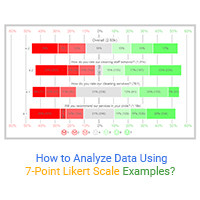
How to Analyze Data Using 7-Point Likert Scale Examples?
Click to discover the most used 7-point Likert Scale examples. You will also learn how to create a 7-point Likert Scale in Excel using different examples.
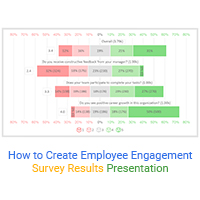
How to Create Employee Engagement Survey Results Presentation
Click to learn to create an employee engagement survey results presentation. Also, we’ll address...
