Manage Your Data Flow.
Maximize Your Results.
Create Sankey Chart in just 3 clicks and save yourself time and money.
- Select chart
- Select data
- Click create chart button
Succeed with ChartExpo Sankey Charts!
Google Sheets
Microsoft Excel
Microsoft Power BI
Free 7-day trial (no purchase necessary). Pricing starts at $10 per month.
 ChartExpo for Google Sheets is
 used by 330,000+ users worldwide!
Click this link to watch a ChartExpo for
Google Sheets single-user installation video.
Click this link to watch a ChartExpo for
Google Sheets admin installation video.
Click this link to watch a ChartExpo
for Excel single-user installation video.
Click this link to watch a ChartExpo
for Excel admin installation video.
ChartExpo for Power BI video.

Simplify Resource Flow Insights
Transform resource tracking, see how resources move, get used, and where they end up—crucial for improving processes in manufacturing or marketing.

Cut Through Data Noise
Distill complex data into clear visuals with Sankey Charts, making data easier to understand at a glance. Ideal for managing large amounts of information without getting lost in the numbers.
Streamline Financial Reporting
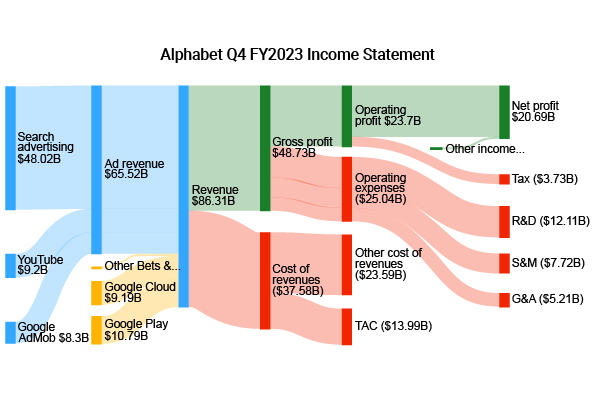
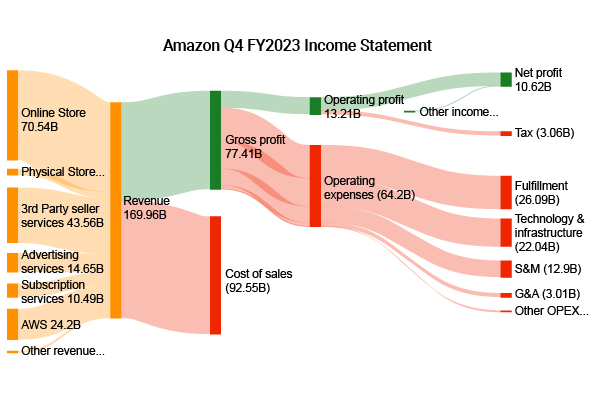
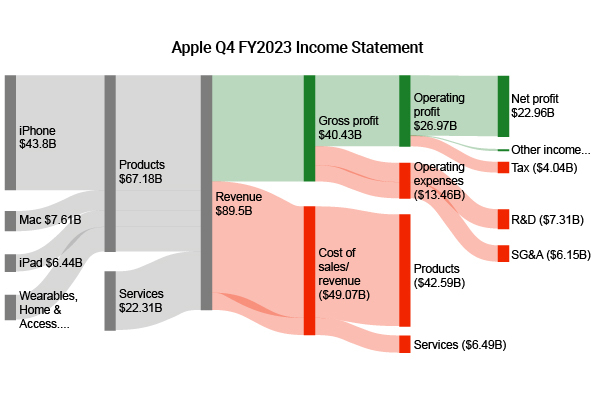
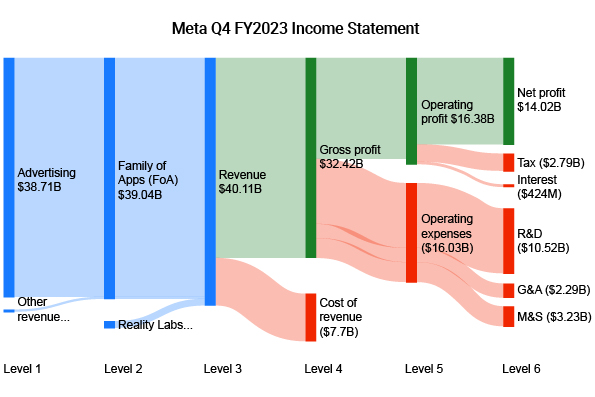
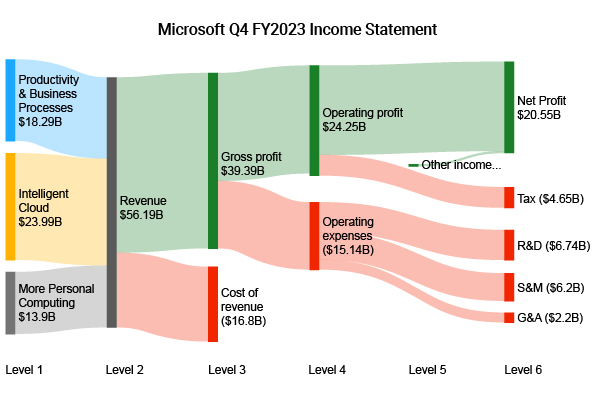
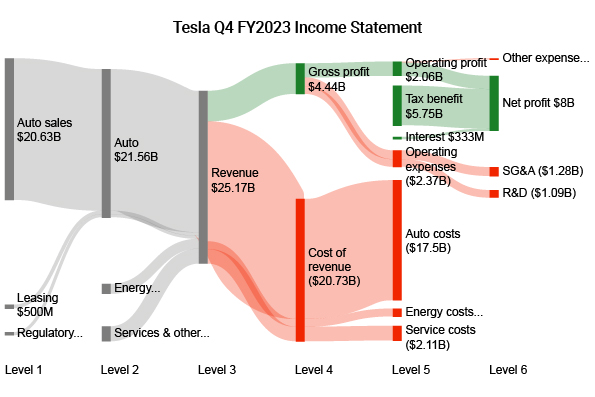
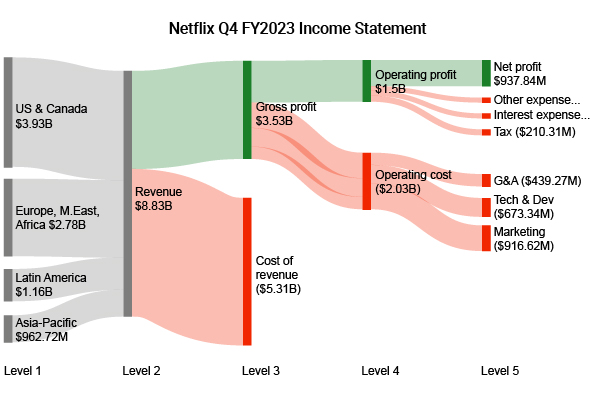
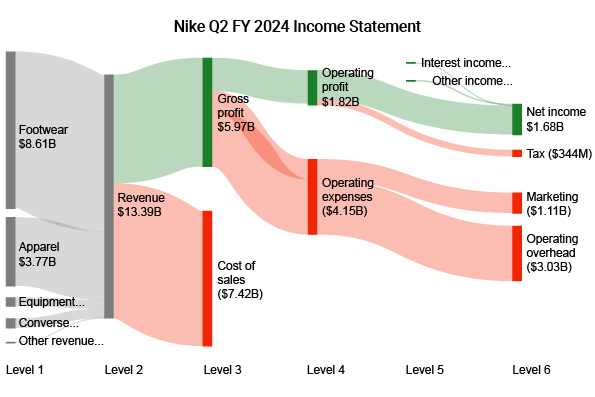
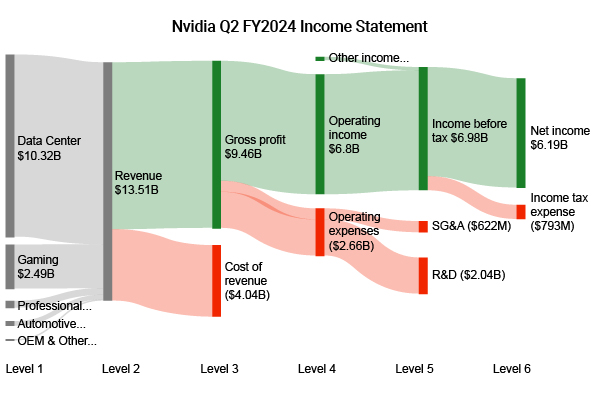
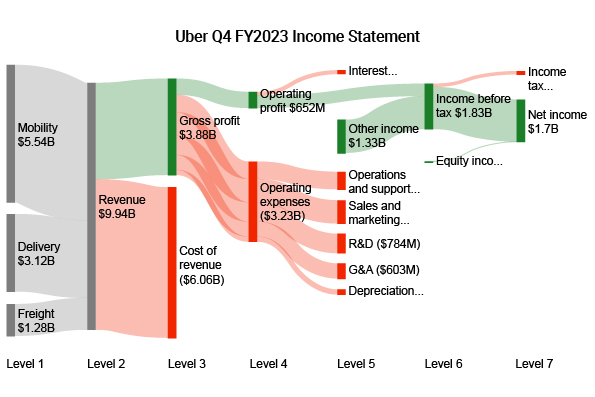
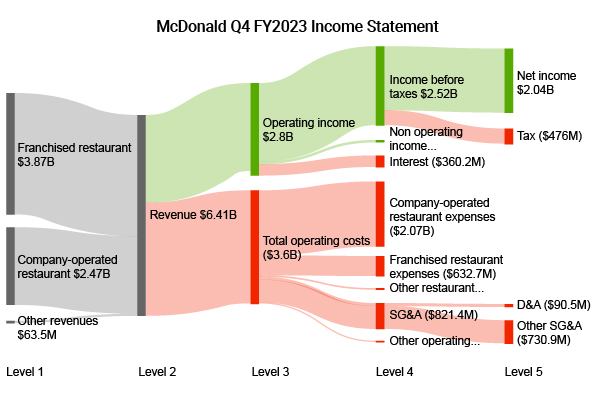
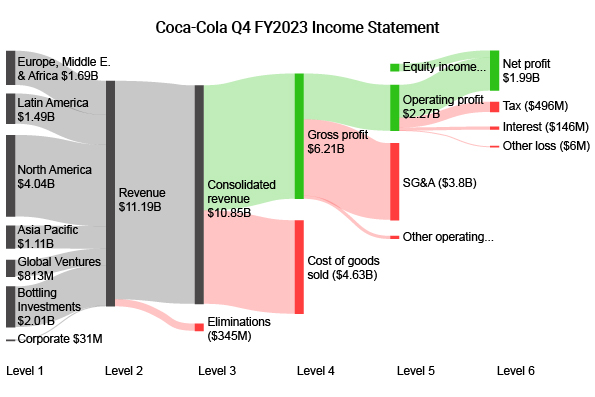
Make financial flows crystal clear, track every dollar's journey through your organization, highlight costly areas, and reveal opportunities for smarter budgeting.
Compare Scenarios Effectively
Use the chart for side-by-side scenario analysis. Compare strategies and identify the most effective approach, such as enhancing shipping routes in logistics or analyzing customer journeys in e-commerce.

Enhance Stakeholder Communication
Turn complex data into insightful visual stories. They help stakeholders grasp key details without needing deep technical knowledge, perfect for reports and strategic presentations.
ChartExpo Pricing
ChartExpo for
Google Sheets
$10*
per month
(no purchase necessary)
*pricing starts at $10
per user per month.
Only in-app purchase available
ChartExpo for Google Sheets
single-user purchase video.
ChartExpo for Google Sheets
domain-users purchase video.
ChartExpo for Google Sheets
single-user installation video.
ChartExpo for Google Sheets
admin installation video.
ChartExpo for
Microsoft Excel
$10*
per month
(no purchase necessary)
*pricing starts at $10
per user per month.
Only in-app purchase available
ChartExpo for Excel single-user
purchase video.
ChartExpo for Excel domain-users purchase video.
ChartExpo for Excel single-user
installation video.
ChartExpo for Excel admin
installation video.
ChartExpo for
Microsoft Power BI
$10*
per month
(no purchase necessary)
per user per month.
Only in-app purchase available
for Microsoft Power BI video
Custom Pricing
Videos
4:20

2:58
2:19
3:47
Blogs
Top 5 Interactive Sankey Diagram Examples
Click to discover the top 5 Sankey Diagram examples. You will also learn how to create a Sankey diagram in Google sheets using different examples without any coding in a few clicks.

How to Create a Customer Journey Visualization?
Click to learn how to create a customer journey visualization. Also, we’ll address the following question: what is a customer journey visualization?
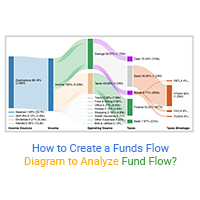
How to Create a Funds Flow Diagram to Analyze Fund Flow?
Click to learn what is a funds flow diagram? And how to create funds flow chart to analyze the funds flow/cash flow.
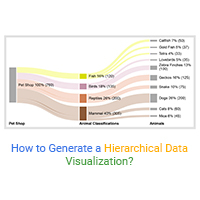
How to Generate a Hierarchical Data Visualization?
Click to discover how to generate a hierarchical data visualization chart. Also, we’ll address the following question: what is a hierarchical data...
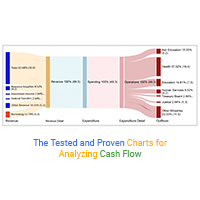
The Tested and Proven Charts for Analyzing Cash Flow
Click to discover the tested and proven way for analyzing cash flow. Also, we’ll address the following question: what is cash flow analysis?
